I’m using secondary groups to manage loads and views in my 3D model.
However, I’m experiencing an issue with viewing my groups in the system visualization.
Please find a test code here:
 +prog aqua urs:19.1
 head materials

 CONC NO 11 C '40' FC 40 EC 35000 GAM 25

 end

 +prog sofimshc urs:19.2
 head Geometry
 SYST 3D GDIV 100000 GDIR NEGZ
 CTRL MESH 1

 loop#i 4
     SPT 11+#i*10    X 0+#i*1000 Y    0 Z 0
     SPT 12+#i*10    X 0+#i*1000 Y 1000 Z 0
 endloop

 loop#i 3
     SAR 1+#i MNO 11 t 100
         SARB NA 11+#i*10 NE 12+#i*10
         SARB NA 12+#i*10 NE 22+#i*10
         SARB NA 22+#i*10 NE 21+#i*10
         SARB NA 21+#i*10 NE 11+#i*10
 endloop

 GRP NO 'grp1'
     SAR 1
     SAR 3

 END
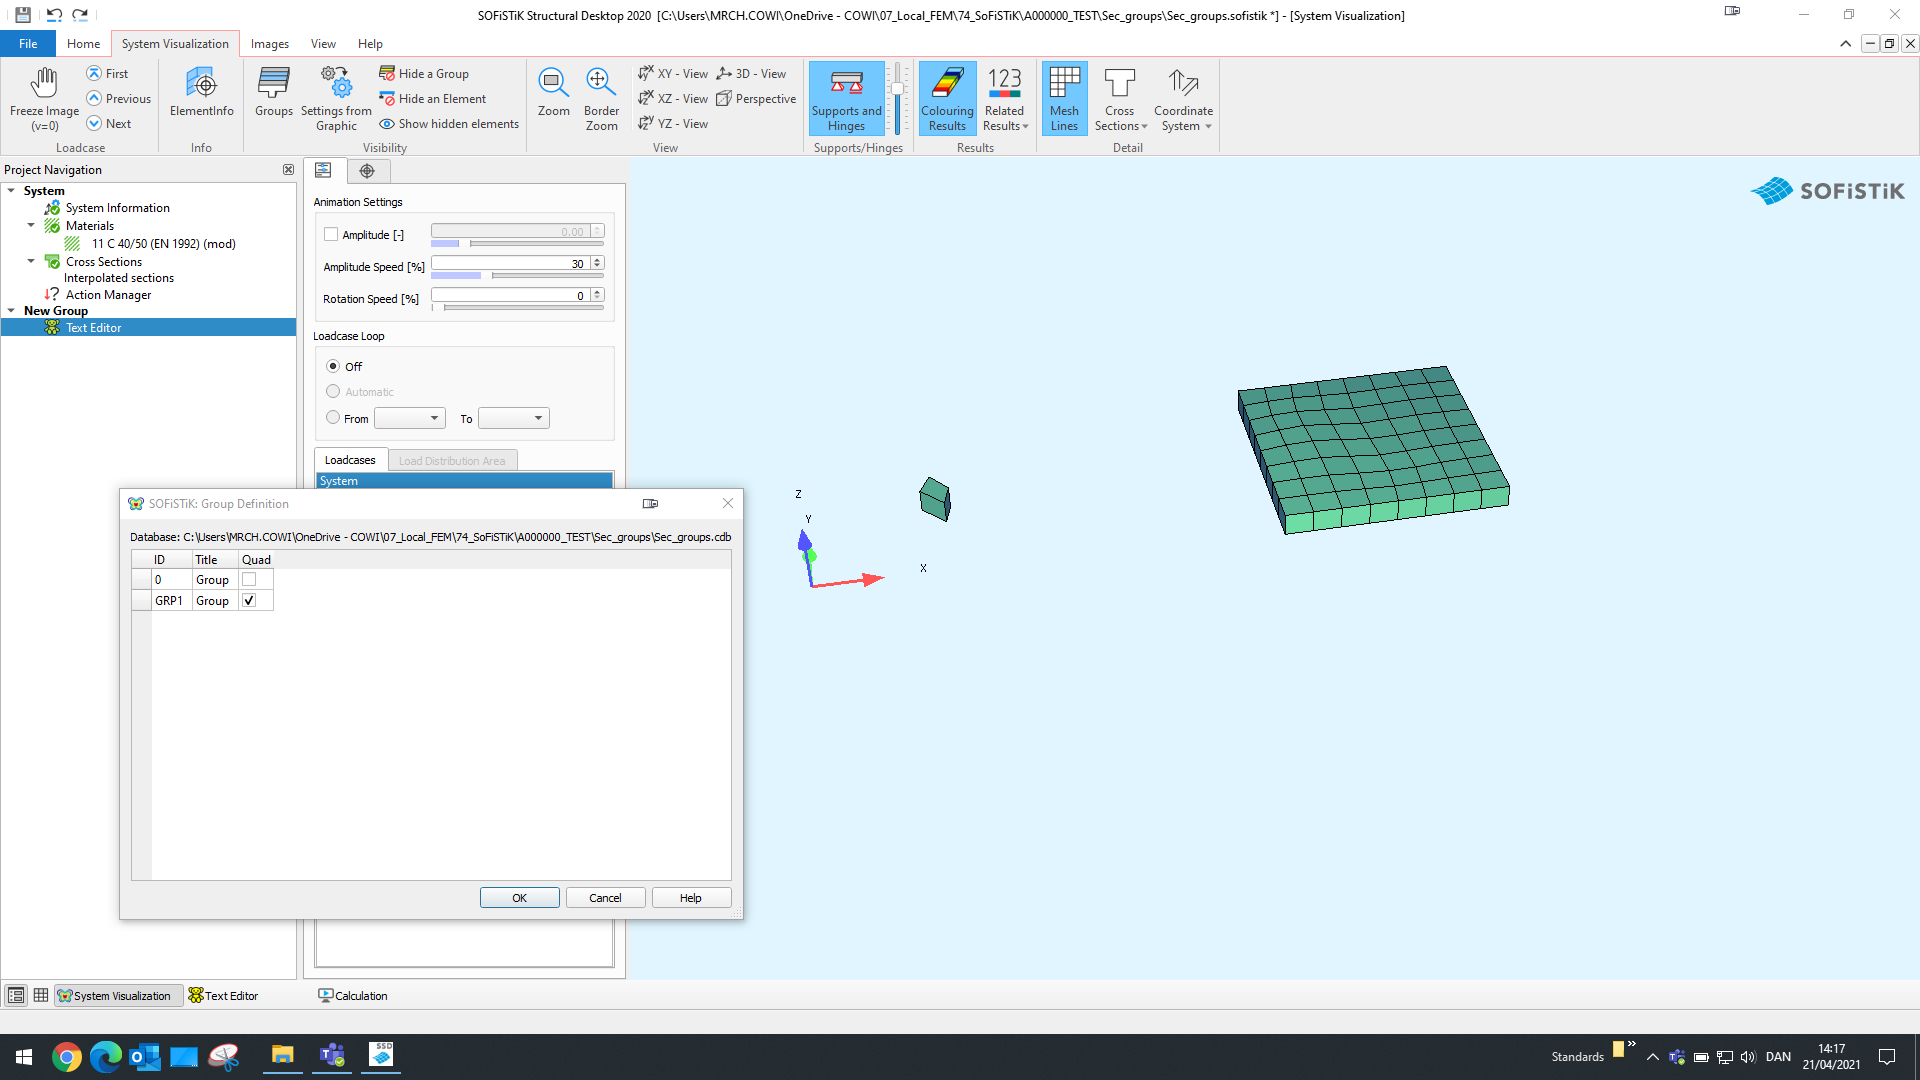
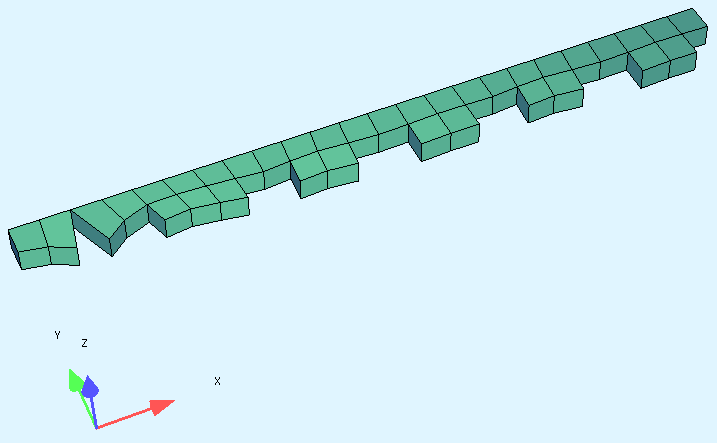
If I try to watch the secondary group in system visualization, I only see one of the SARs along with a single mesh element?
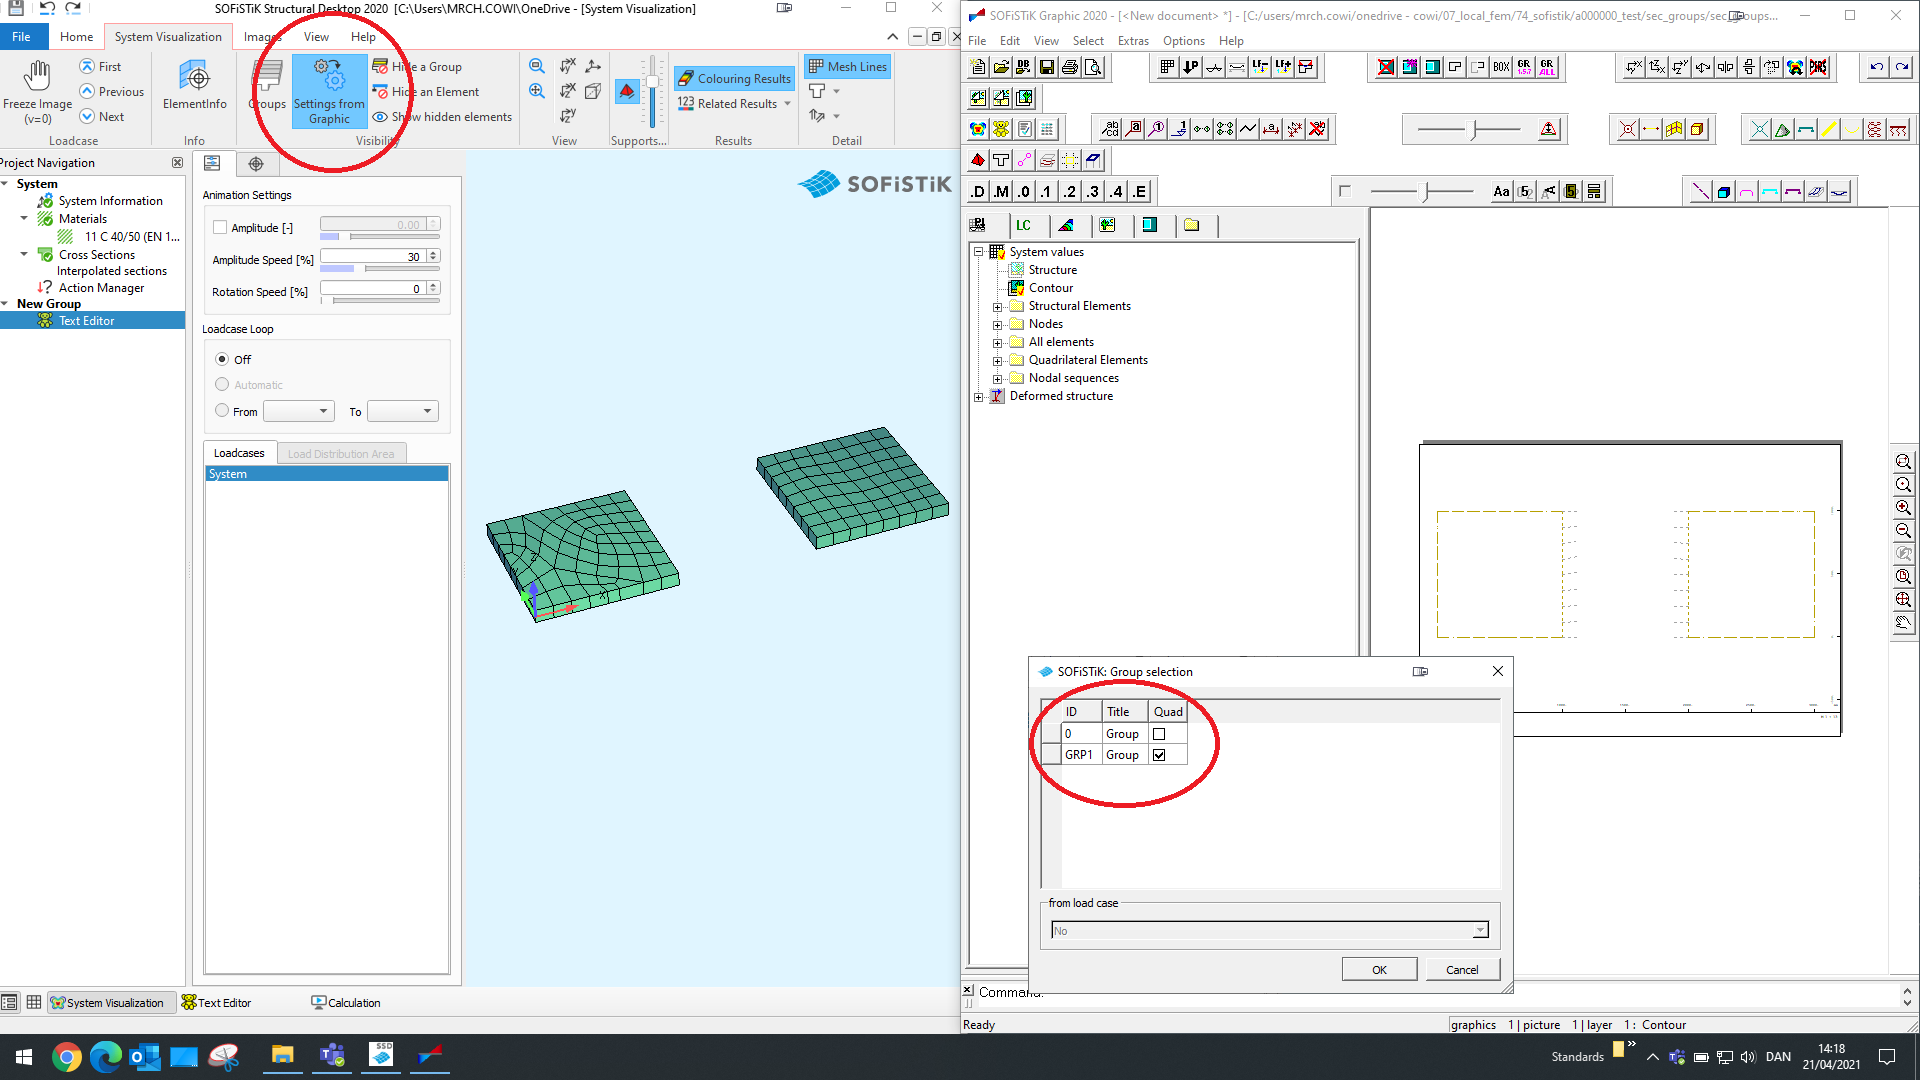
However, if I open Graphic, and pick the secondary group in there, and use the “Settings from Graphic” in system visualization, I see the group as it’s supposed to.
Please excuse me for reviving this post, but as this was where I originally reported the issue, I figured I’d just do it here again. If I should direct my inquiry elsewhere, please let me know.
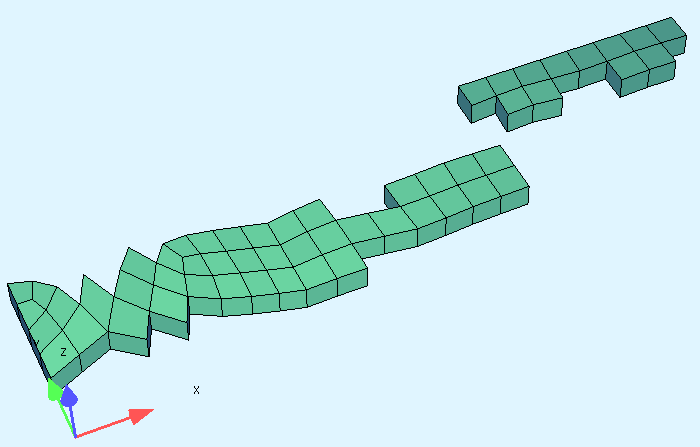
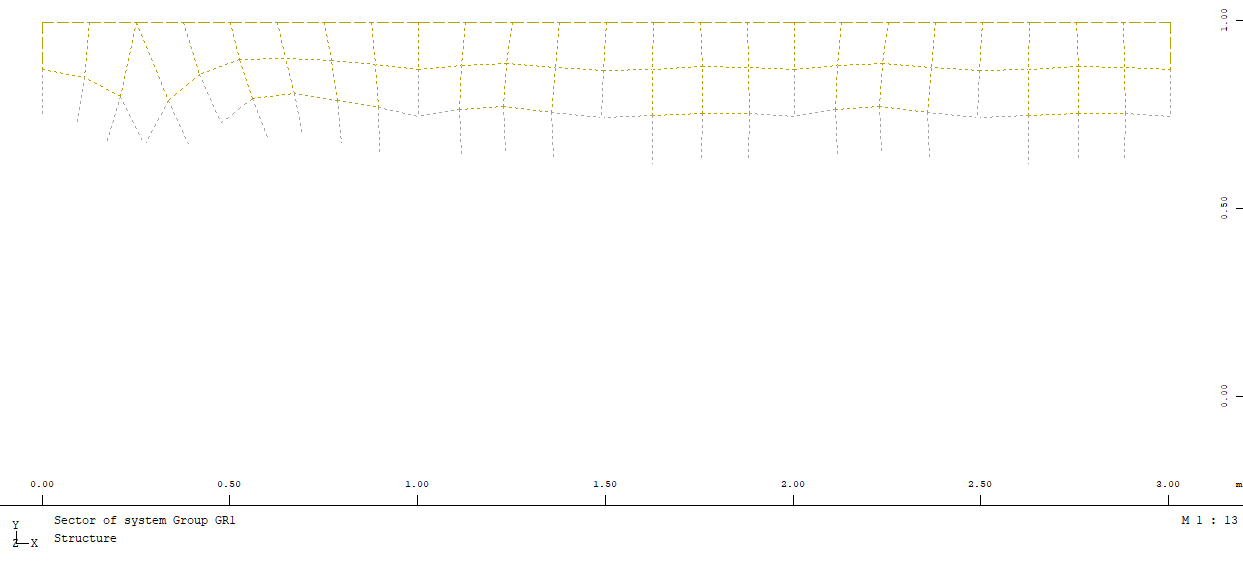
I am experiencing similar problems in Sofistik 2023 with secondary groups yet again. This time only periodic, meaning that the issue may or may not present itself from run to run.
Using the old code from this thread I’m creating a secondary group using BBOX:
+prog aqua urs:19.1
head materials
NORM DC EN 199X-200X G 9.81
CONC NO 11 C '40' FC 40 EC 35000 GAM 25

end

+prog sofimshc urs:19.2
head Geometry
SYST 3D GDIV 100000 GDIR NEGZ
CTRL MESH 1
unit 6

loop#i 4
    SPT 11+#i*10    X 0+#i*1000 Y    0 Z 0
    SPT 12+#i*10    X 0+#i*1000 Y 1000 Z 0
endloop

loop#i 3
    SAR 1+#i MNO 11 t 100
        SARB NA 11+#i*10 NE 12+#i*10
        SARB NA 12+#i*10 NE 22+#i*10
        SARB NA 22+#i*10 NE 21+#i*10
        SARB NA 21+#i*10 NE 11+#i*10
endloop

GRP 'GR1'
    BBOX xmin 0 xmax 3000 ymin 750 ymax 1000
$    BBOX xmin 0 xmax 3000 ymin 0 ymax 250

END