Hi
Is there any way to scale the axes individually in wingraf?
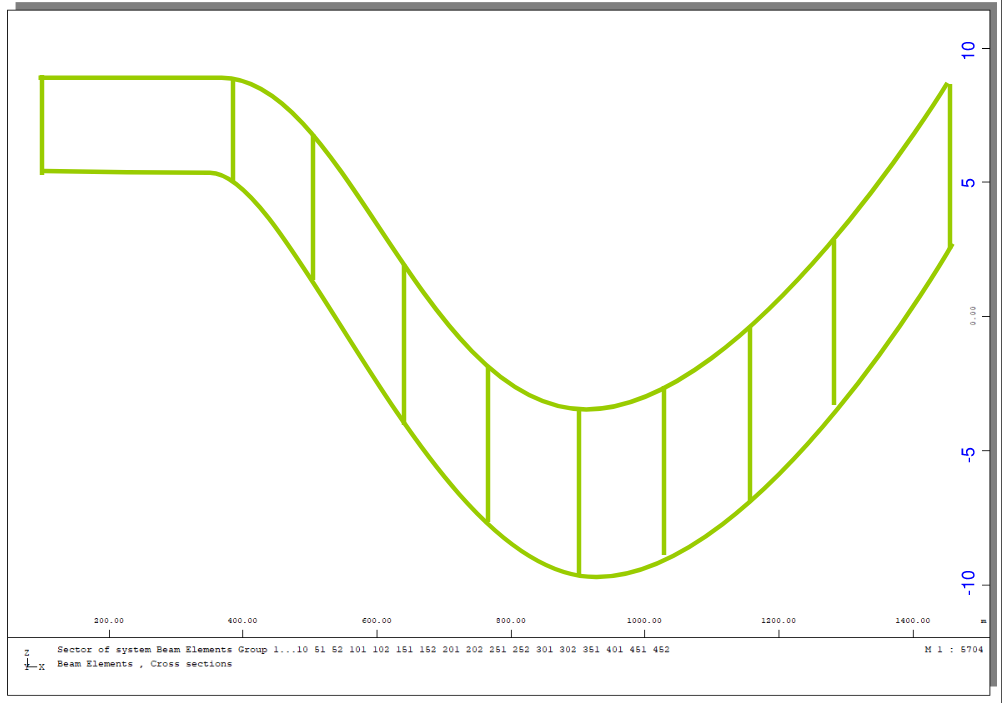
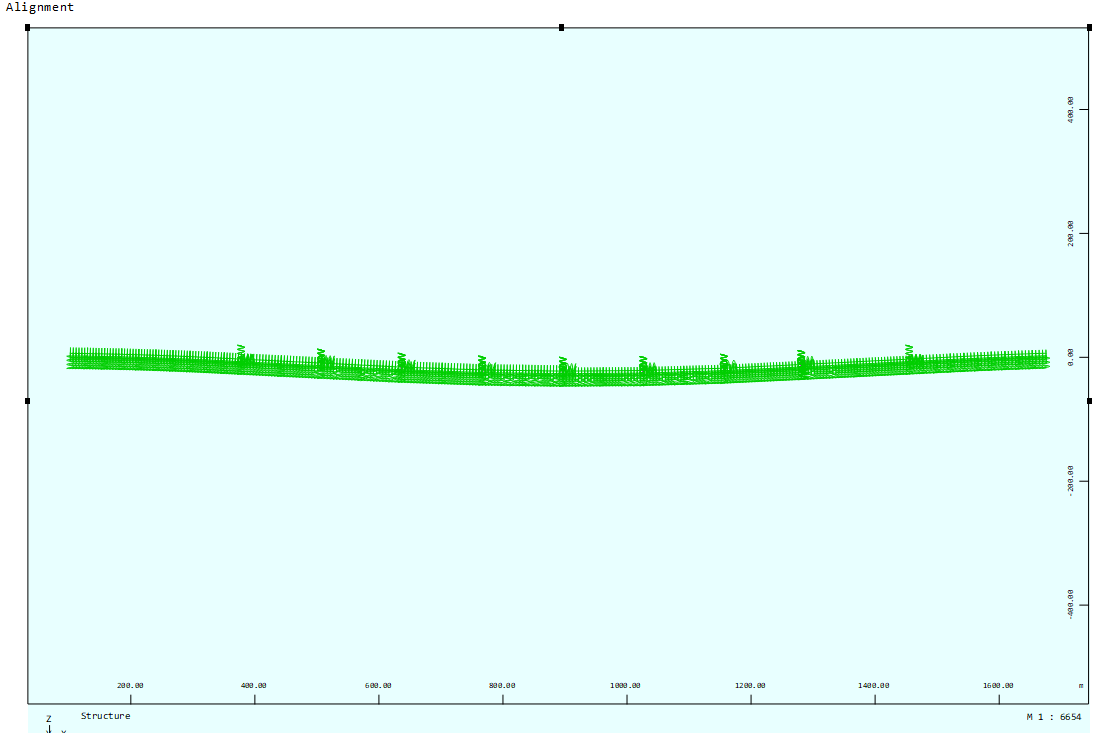
I have this tunnel structure:
I would like to scale the vertical axis, so the final picture would look something like this:
Hi
Is there any way to scale the axes individually in wingraf?
I have this tunnel structure:
I would like to scale the vertical axis, so the final picture would look something like this:
Hello
This is only possible with text input.
So at first I would create the desired graphic with the Graphic.In the next step, the saved file can be opened with the TEDDY. Now you can adjust the view (in PROG WING) using the VIEW SCAL comand.
Best regards
Frederik Höller
Your SOFiSTiK Support Team
Hello, thanks for the reply.
I have tried the following in a 100 different combinations but it doesn’t change anything:
PROG WING urs:1
$ GRAPHIC document (version ####-##.## build #######) from Service Pack 2023 Build 86  8.10.22 , 16:00:07
HEAD $  Structure
UNIT 0 SET IN $ default unit set

CTRL OPT GSTR VAL DEFA
CTRL OPT REPR VAL YES
$ DB   NUMB 1 TITL "c:\users\mrch\documents\github\a222090-fraser\3d_global_model\mrch.cdb"
CTRL OPT AXIS VAL DEFA
$ graphics    1 | picture    1 | layer    1 :  Structure
PAGE LANO 1
SIZE TYPE URS SC 0
SIZ2
AND  POSI 1 POSL 0 POSR 100 POSD 0 POSU 100
LC   NO 1 DESI 1
BOX
VIEW TYPE DIRE X 0 Y 1 Z 0 AXIS NEGZ ROTA 0
SELE NUMB 0
STRU NUME FULL FILL NO REPR DSTR UNIT DEFA SCHH YES
view scal x 1 y 1 z 4
END
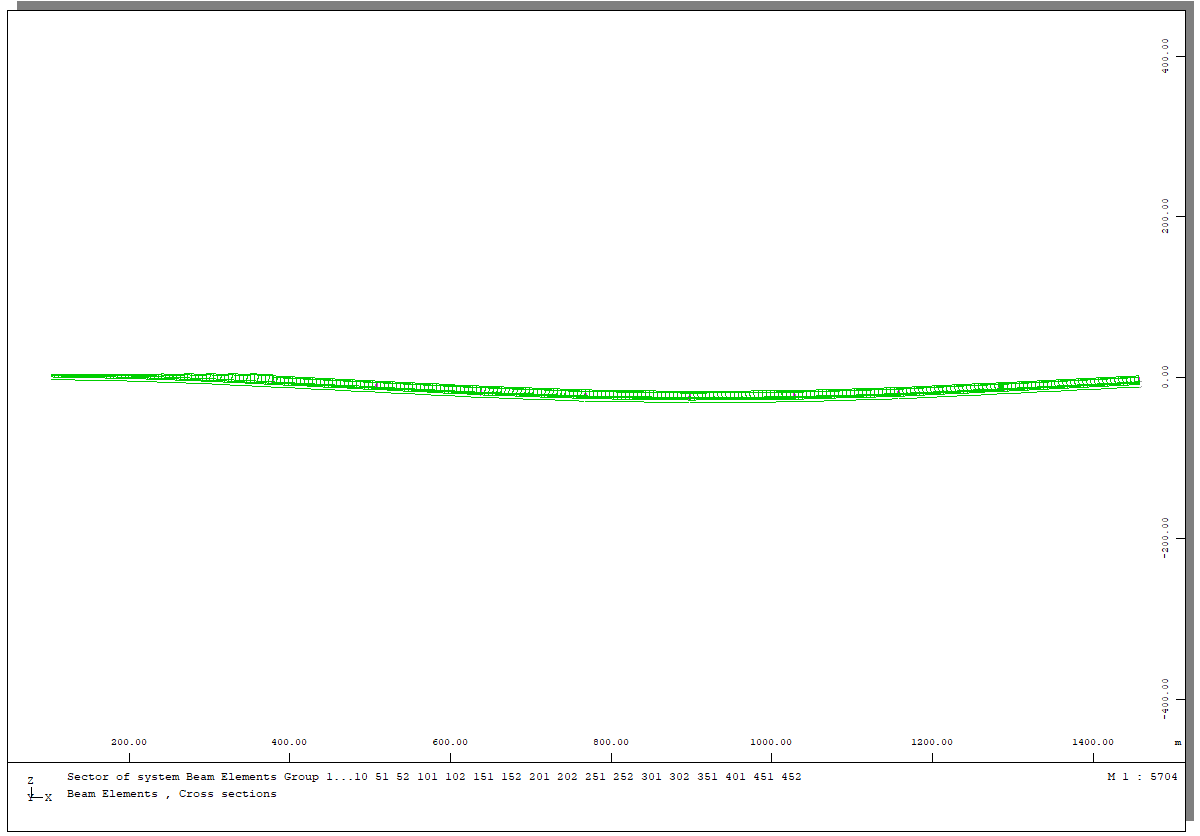
The view looks like this no matter the input:
As far as I know you can’t use the comand VIEW for multiple definitions in one plot.
Did you try your code without the following line?
VIEW TYPE DIRE X 0 Y 1 Z 0 AXIS NEGZ ROTA 0
Otherwise I don’t see any other function to deform the view of the graphic.
It still doesn’t work.
Funny thing though. Looking through the example files I found the command used in C:\Program Files\SOFiSTiK\2022\SOFiSTiK 2022\hydra.dat\english\hydration\hydrat1.dat
PROG WING urs:7
HEAD CUTS
SIZE -WIN 10 SCAL XY
VIEW SCAL 2 1 AXIS NEGY
...
Which actually seems to work. Even with multiple uses of the VIEW command.
I can’t seem to transfer the functionality to my own code though.
Try placing both view commands before the stru command
That certainly does something similar to what I’m looking for!
Now I just need to figure out exactly what is going on because it would seem that the SCAL command also rotates the view for some reason, but I think that might just be a matter of testing until I find the correct input.
The wing program looks like this now:
PROG WING urs:1
HEAD Structure
    VIEW TYPE DIRE X 0 Y 1 Z 0 AXIS NEGZ ROTA 0
    VIEW type SCAL 1 1 10  AXIS NEGZ
    STRU NUME FULL FILL NO REPR DSTR UNIT DEFA SCHH YES
ENDTry not to specify the axis your looking “through”, e.g. x 1 z 10 and sometimes it works better neglecting the axis negz part (use -10 instead)
Try not to specify the axis your looking “through”, e.g. x 1 z 10 and sometimes it works better neglecting the axis negz part (use -10 instead)
Is this understood correctly?
where would you put in the -10?
PROG WING urs:1
HEAD Structure
    VIEW TYPE DIRE X 0 Y 1 Z 0 AXIS NEGZ ROTA 0
    VIEW type SCAL x 1 z 10
    STRU NUME FULL FILL NO REPR DSTR UNIT DEFA SCHH YES
END
IF your image is flipped with your code snippet the second view command can be specified as:
View Type Scal X 1 Z -10
Hi,
Was it finally working well?
I have tried hard any combination of view commanda, placing it in any combination of places inside wingraf code, however always it works like only one view command is active. Any solution…?
No unfortunately I never managed to get it to work
I finally maganged to understand how it works.
Since you cant use double view, command SCAL is not only scaling but also setting view direction.
HYDRA example works because it is flat (z=0) for all nodes. However when you have 3d model to get 2D scaled picture you have to shrink one of dimension to very low (not zero) value.
For example to get scale bridge x:z 1:4 > VIEW SCAL X 1 y 0.000001 Z 4 axis posz
Standard view dire:
with scal: VIEW TYPE scal X 1 y 1e-6 z 6 AXIS POSZ ROTA 0
At least after 3 years…
This looks really great! awesome that you actually made it work!
Can you write the full wing program similar to what I’ve done here?
Then I’ll mark your response as the solution!
Here you are
PROG WING
HEAD Structure
VIEW type SCAL x 1 y 1e-6 z 10 axis posz
STRU NUME FULL FILL NO REPR DSTR UNIT DEFA SCHH YES
END
I think something is still missing.
PROG WING urs:1
HEAD Structure
STRU NUME SECT FILL NO REPR DSTR UNIT DEFA SCHH YES
END
X-axis plots from 10000-14000, Z-axis plots from -1000-1000
Implementing your code:
PROG WING urs:1
HEAD Structure
VIEW type SCAL x 1 y 1e-6 z 10 axis NEGZ
STRU NUME SECT FILL NO REPR DSTR UNIT DEFA SCHH YES
END
X-axis plots from 1000-2000, Z-axis plots from -100-100
and further:
PROG WING urs:1
HEAD Structure
VIEW TYPE SCAL X 1 Y 1e-6 Z 100 AXIS NEGZ
STRU NUME SECT FILL NO REPR DSTR UNIT DEFA SCHH YES
END
X-axis plots from 100-200, Z-axis plots from -10-10
So the x-axis is also being scaled even though I explicitly define it to 1?
It is solving x^2+y^2+z^2=1 solution so it always take the biggest scale as 1, so you x axis gets shrinked, and z stays as 1,0. But proportion is there
I’m not sure I follow, the pictures of the bridge you showed, the X-axis seems unaffected?
That’s the whole point.
If it scales the x-axis when I scale the z-axis, it’s just equivalent to zooming?
No it is not zooming.
In my bridge example x-length of model is ~600m. After scaling z:x by 4:1 it is ~150m.
It is like this:
x 1 / z 4 → calulcated as x 0.25 z 1
Anyway you have scaled model, but it is shrinked in x dimension instead of elongated in z dimension.
Drawing is scaled as we wanted, only axis describtion is different.
What can you do? Turn off axes, and describe x-axis yourself by x*scal