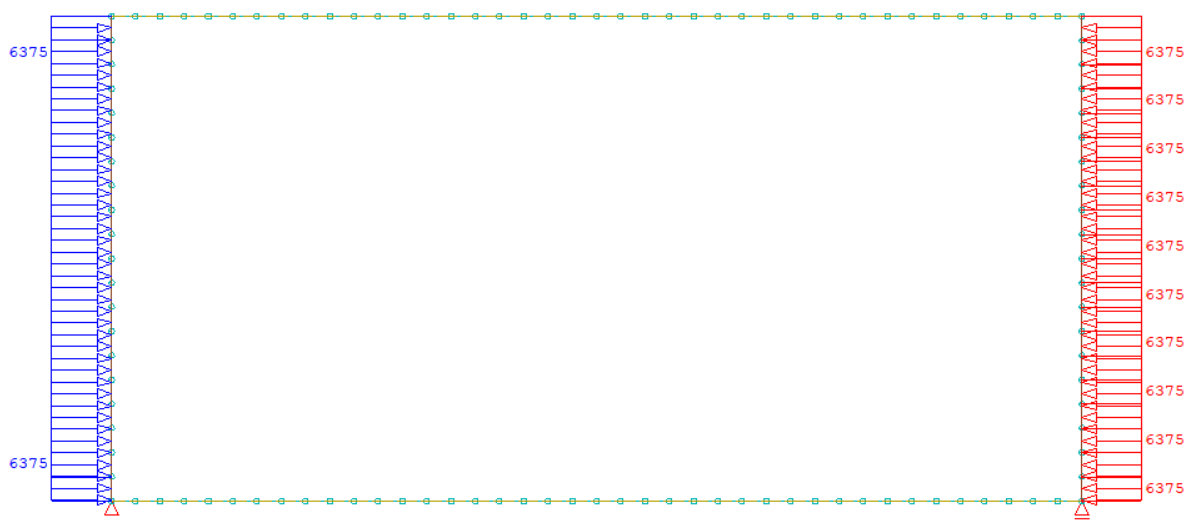
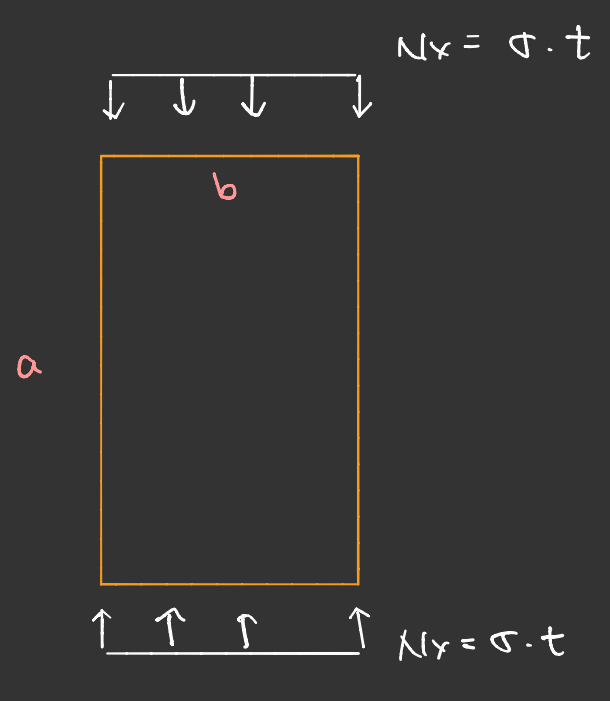
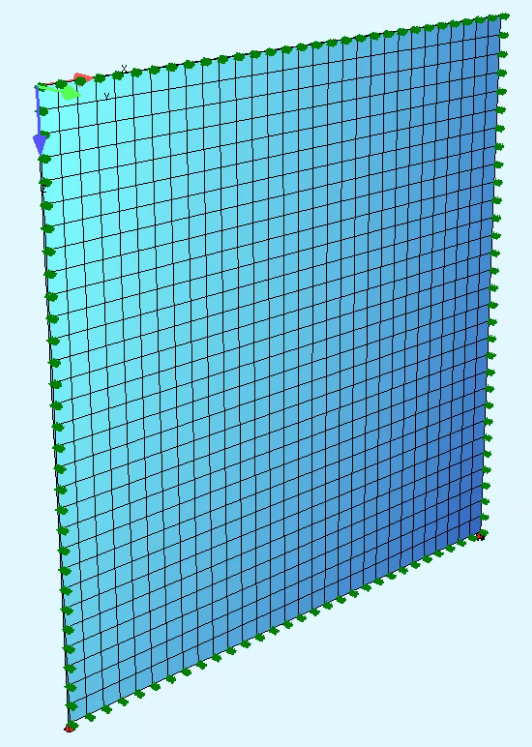
I have been trying to perform a non-linear analysis of a rectangular steel thin plate considering a full geometric non linear analysis and a non-linear behaviour of steel. The thin plate is a 1000x2000x20mm (bxaxt) which is uniformly compressed in the 1000mm side. The material is a S355 with yielding plateu. The E is 210000 MPa for the elastic part and then E/10000 when the stress is higher than 355MPa. Then, a value of 0.3 of Poisson’s ratio. All the plate borders simple supported allowing the in-plane movement.
In ASE I have used the following code:
+PROG ASE
HEAD
OBLI LC 2001 VMAX 5.000[mm] DIRE YY
NSTR KSV UL
ULTI 100 FAK1 0.01 DFAK 0.2 PRO 2 DMIN -0.0001
SYST PROB TH3 NMAT YES
LC 300 ; LCC 11 $ pressure
END
The OBLI to scale the first buckling mode to a maximum geometric imperfection of 5mm (b/200 - EN 1993-1-5. Annex C). This obtained by previous ASE. Also, this buckling shape verified by numerical estimations. Then, NSTR to use the stress-strain diagram that I mention before. ULTI to get the ultimate strength of the plate, and SYST to activate the nonlinear problem. Finally, the LCC11 is the load case with the uniform compression in the 1000mm side which is the load case about to be increased in the iteration.
Then, my concern is in this last step for two reasons:
The final result of the iteration converges on a value around 10% below both numerical estimations and the EN 1993 standard.
Fmax(Ansys)=5297kN/m
Fmax(EN 1993)=5232kN/m
Fmax(Sofistik)=4867kN/m
I have already verified that the material factor is not used in order to make proper comparisons with other data. Indeed, using the ULD the result is lower.
By changing the different functions in ULTI and other ones in ASE the results does not change much. Also, by changing the solver in CTRL and using the stress-strain diagram given for the S355 in AQUA, the result does not change much. I have tried already the same example with other steel grades, and other stress-strain diagram which gives the same results. Also, similar examples with other dimensions making the same process gives an error of around 10%. Furthermore, I have tried changing the mesh size and the error tolerance in the iteration which also does not give considerable changes.
Therefore, I would like to know which is the mistake I am making with the algorithm in ASE I am using or if there is something I am either using wrongly or missing.
I tried without OBLI, NSTR and TH3.
So:
+PROG ASE urs:13.1
HEAD
$OBLI LC 2001 VMAX 5.000[mm] DIRE YY
ULTI 10 FAK1 0.1 PRO 2 EPSS 355/210
SYST PROB NONL NMAT YES NSTR KSV ULD
LC 300; LCC 11 fact 1 pressure = 10000kN/m
END
Wth EPSS = 1.69 we got 5000kN/m or 250MPa
With EPSS by default is 25, we will get 7500kN/m, i.e.7500/0.02=375MPa limit.
I have tried what you used and, when I use either 1.69 or 25 as EPSS, I get 6375kN in both solutions.
I attach my .dat which I have used at the bottom of this message. Furthermore, I noticed that if LC11 has a lower value, the solution converges in a lower value different than 6375kN. I used at the beginning a starting value of 20kN/m. Is it something wrong on what I did? Or does it has something to do with the type of solving equation in ASE?
On the other hand, as it is a non linear problem to obtain the resistance in ULS of the plate, I have to introduce imperfections. In this case, as I don’t have enough data to introduce geometric nor structural imperfections, I have introduced a equivalent geometric imperfection of b/200 following the first buckling mode. May I ask why didn’t you use OBLI?
Finally, I would really like to know why you used NONL instead of TH3.
Hi, Marck.
Please compare with EPSS 1.69 and $EPSS 1.69.
When we comment EPSS we set this to default 25 promille. ULTI always works with this parameter and NSTR with KSV (any curves) does not work with ULTI process and makes no sense.
I think OBLI and NSTR makes sense to use only when calculating for certain combinations, but not to determine the limit load when we use ULTI.
Best regards,
Ilyn
I used the default parameters of material for the S355 in AQUA and now, by using what you wrote in the previous message, I obtain the 7500kN/m for $EPSS 1.69. Nonetheless, for EPSS 1.69, The iteration finishes on 7000kN/m instead of 5000kN/m. I understand the EPSS controls the iteration, but for a non-linear analysis I thought it was allowed to choose the stress-strain diagram to work with.
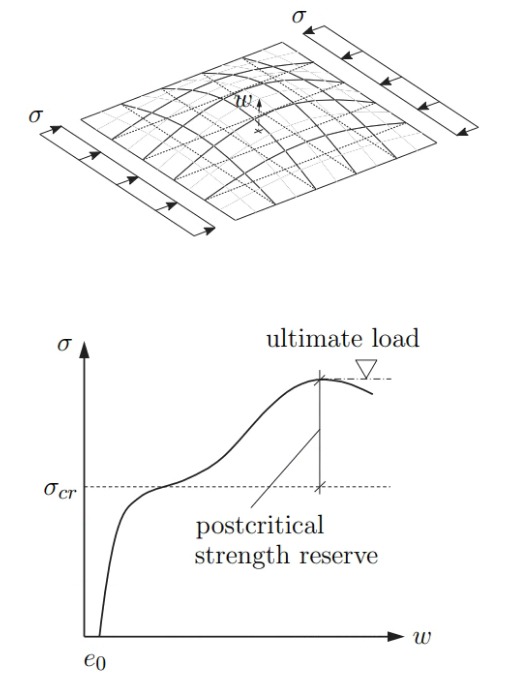
In any case, how may I perform a non-linear analysis considering geometric non-linear effects and material non-linear effects of a steel thin plate to obtain its ultimate strength? This considering the geometric equivalent imperfection of the first buckling mode and a possible specific stress-strain diagram specified in AQUA. The purpose of this is to analyze the pre-critical strength and post-critical strength due to buckling of an unstiffened plate, to then analyze a more complex stiffened plate.
Yes, in example ase12_buckling_slab.dat we can find approach wich you used for stress-strain curve and imperfection. Today, in your example I reach the same results (0.7 for both cases: EPSS 1.69, and $EPSS 1.69). Please find attached 2 dat files with one side loaded plate. thin_plate_ulti_sofistik.dat (2.4 KB) thin_plate_ulti_exp.dat (1.5 KB)
Nonlinearities, as I undersatnd, described in SYST NONL NMAT YES.
Best regards
Yes, but in that example the imperfection does not follow the first buckling mode and, if it does follow it (by adding an OBLI with 6mm of amplitude equivalent to b/200), the limit load is lower. In both cases, the limit load in ultimate state is lower than the theoretical one by around 5%. As it is a FEM model, it should be higher.
Thank you very much for the example attached, but it is not the thin plate that I explained. It should be a plate simple supported in the four borders and uniformly compressed in two borders like the first three images I attach at the end of this message.
Sorry for the insistence on the topic, but I would really like to get an explanation about the process that SOFiSTiK does with ULTI deeper than the one which appears in the manual because, as far as I understood, it does not calculate the limit load that I am trying to get. Therefore, I would like to understand what it is about to then use it properly. On the other hand, may I ask again the question I made before which I quote:
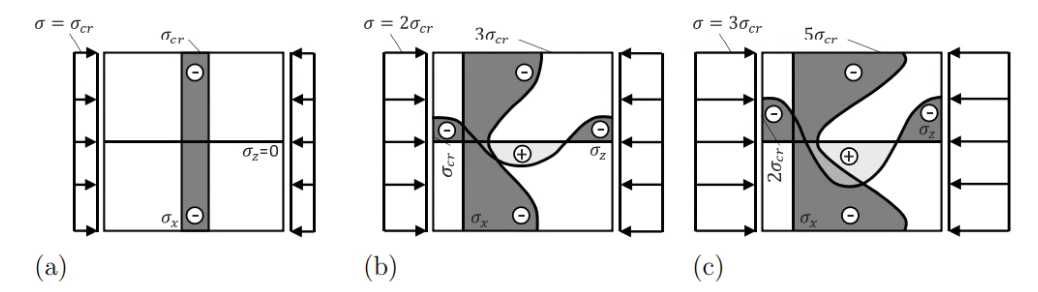
To get an idea of what more or less I am trying to perform by this analysis, I attach the kind of results I am trying to get (last two images).
Finally, is there any way to perform a controlled deformation analysis in SOFiSTiK? Instead of iterating with load as ULTI does, to do it with deformations.
Kindest regards and sorry again for the insistence on this topic,
Marck
In the following images: sigma-cr (critical plate-like stress), e0 (initial deformations)
(x as the horizontal axis and z as the vertical axis in the second image)