Unterschied zwischen Eingabelasten und aufgebrachten Lasten

Hallo zusammen,

ich wende mich heute mit einer vermutlich schnell beantworteten Frage an das Forum:

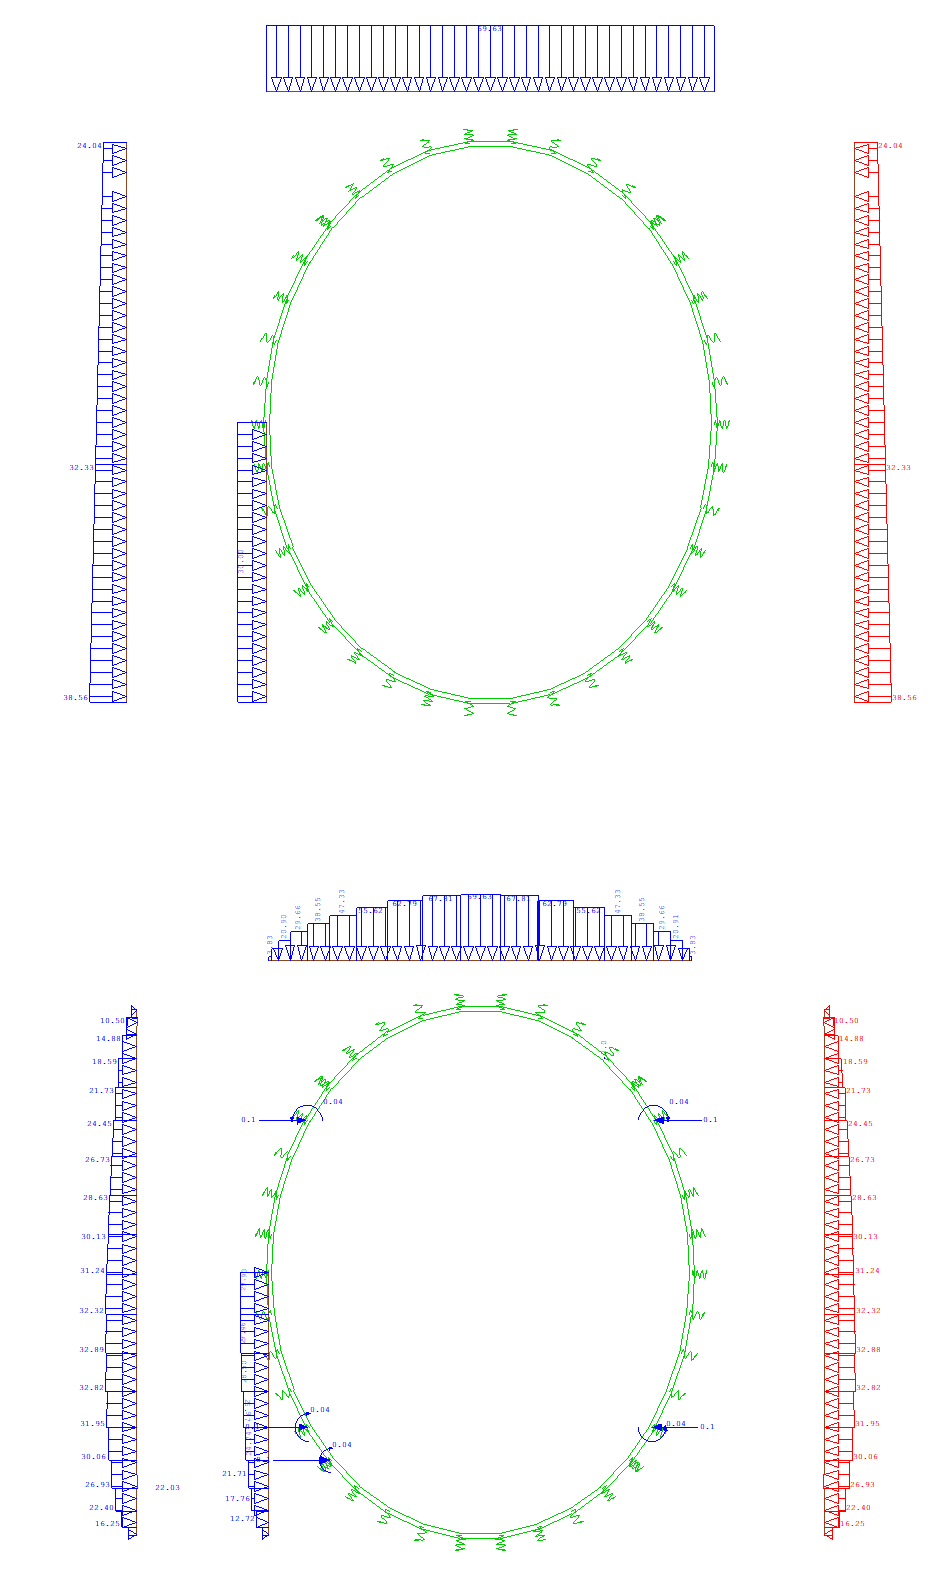
Ich habe einen ovalen Querschnitt und bringe Lasten in globale Koordinatenrichtungen auf. Schaue ich mir nun im graphic die Eingabelasten und die aufgebrachten Lasten an, wird ein signifikanter Unterschied deutlich, den ich mir nicht erklären kann, siehe anhängendes Bild.

Die Lasten werden kleiner zum Rand hin. Was geschieht dort?

Hard to say exactly without seeing the code, but a guess is:

  • You are applying the load as a free area/line load

  • Projection is relative to the projection area/line (like snow)

  • Input load is your “raw” value, e.g. 10 kN/m

  • Used load is the projected value, which varies.
    E.g. 10 kN/m in the “middle”, 6 kN/m at the “quarter point”

This would be due to the element length being longer than the projected length (element not perpendicular to force)