Greetings!
I’m a student who’s just getting started with Sofistik.
I’m trying to understand how the software works and how to interpret the results.
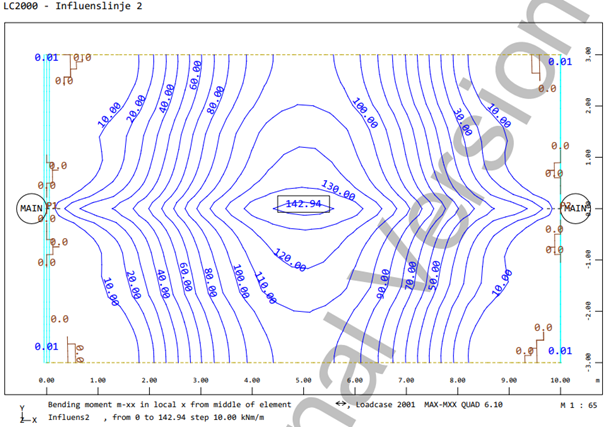
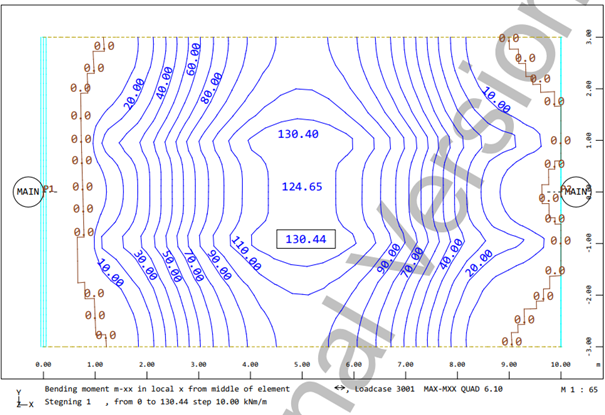
I’ve created a load model, which I’ve evaluated using the softwares influence lines through ELLA and compared the results with “load-stepping” through Sofiload and ASE.
Why does ELLA create these circles, whilst the outcome from Sofiload and ASE seems more realistic?
Hi Tobias,
to get almost same results with load stepping and ELLA you must assure that loads are applied in the same way.
Without data set I can only assume:
When you define in ELLA “LSEL … INT 0” loads are applied as single loads and moments along a node sequence. With “LSEL … INT 1/2” two node sequences get loads and moments. With “LSEL … INT 3/5/7/9” transverse influence lines are calculated and used.
In your system obviously loads shall be applied onto quad elements. Then INT 3/5/7/9 has to be used.
Best regards,
Jost
Ah, I see.
Switching from INT 3 to INT 9 gave much better results.
Cheers!
Another question has popped up.
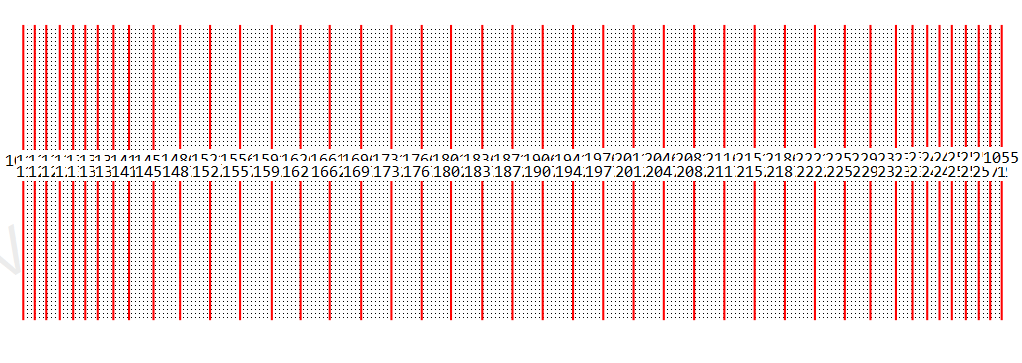
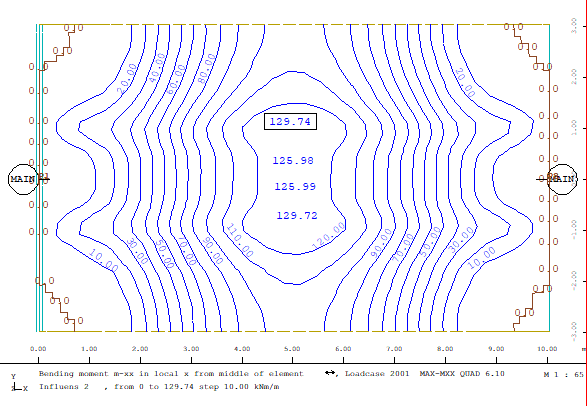
I’m currently working on a small report on the results and was just wondering if this image illustrates the transverse influence lines that ELLA has created?