im Result Viewer kann man sich für Stabelemente grafisch den Verlauf der Spannungen und Dehnungen anzeigen lassen. Besteht diese Möglichkeit auch für Schalenelemente? Ich kann lediglich den Spannungsverlauf im Animator einsehen.
Hello all,
In the Result Viewer it is possible to display graphically the course of stresses and strains for beam elements. Is this also possible for shell elements? I can only see the stress distribution in the Animator.
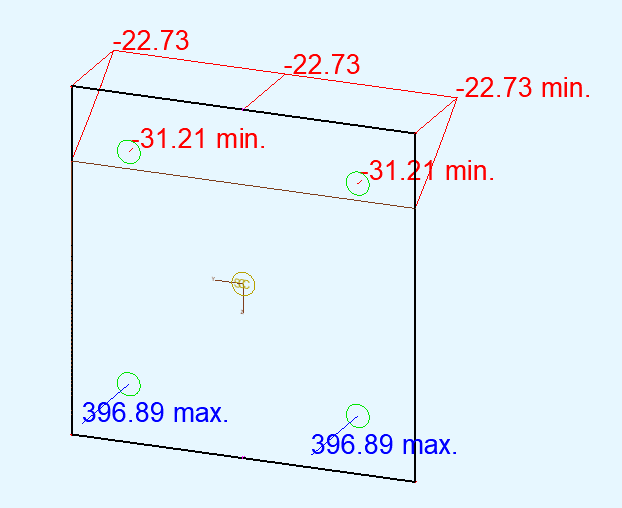
thank’s for you reply. Is it possible to display the nonlinear strain and stress distribution in Wingraf for QUADs like BEAMs (see attachment)? I don’t know how to do this in WinGraf…
I think I understand what you mean. Perhaps, in slabs there is no such representation, since the quad shape can be arbitrary and the reinforcement there is represented rather by an abstract area of steel, when, like in a bar, we always know its cross-section and the exact location of the reinforcement.
If I had a similar task of drawing a nice visual picture, I would read (or export to excel) the results from cdb and draw it.
That is why I always motivate people to use programming - if something is missing in the program, you just create a component Drawing pictures is definitely easier to understand nonlinear calculations.
The Qt library provides excellent drawing capabilities, creating all kinds of windows, and so on.
Examine the text below with F1, change some parameters. Perhaps you will find the export of the results you are looking for.
+PROG RESULTS urs:22.1
HEAD
$ C:\sofidata\maxim_nl_plate\maxim_nl_plate.cdb
$ Begin Page 1
SIZE TYPE "-URS" SPLI "2x1"
$ Begin Grafic/Table/Diagram 1
PICT SC DEFA W DEFA H DEFA SPLT   NO
GRP
XLSX NAME "C:\sofidata\quad_export.xlsx" WS "XLSX-Export" ROW 1 COL 1 CLNM  YES TIME   NO CDB   NO ELEM   NO FILT   NO RESU   NO
JOIN
DBO  NAME "node._enr" WIDT 35
FILT
LC   NO 101
LC   XI  FAC XIV 0
$ Begin Result 1
TXTP SHOW SIGN OVLP AMAX
QUAD TYPE HSLA STYP ELEM REPR DLST
END
 Drawing pictures is definitely easier to understand nonlinear calculations.