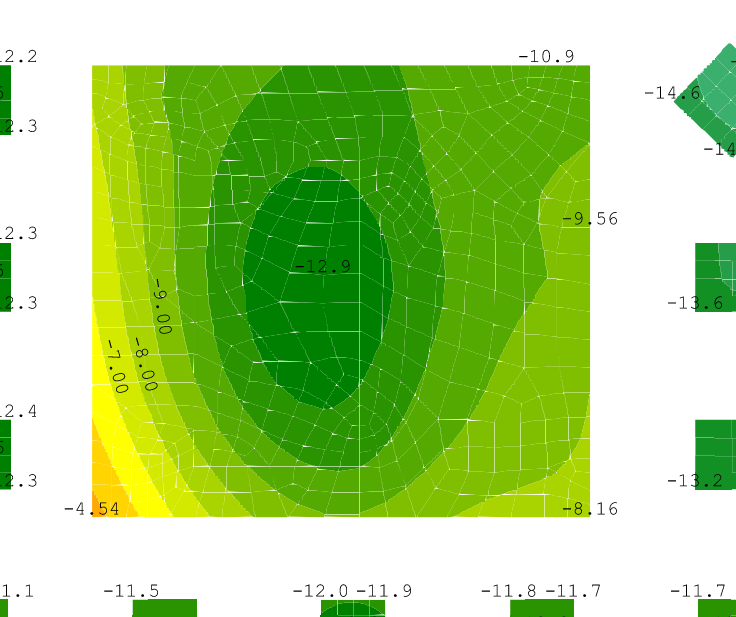
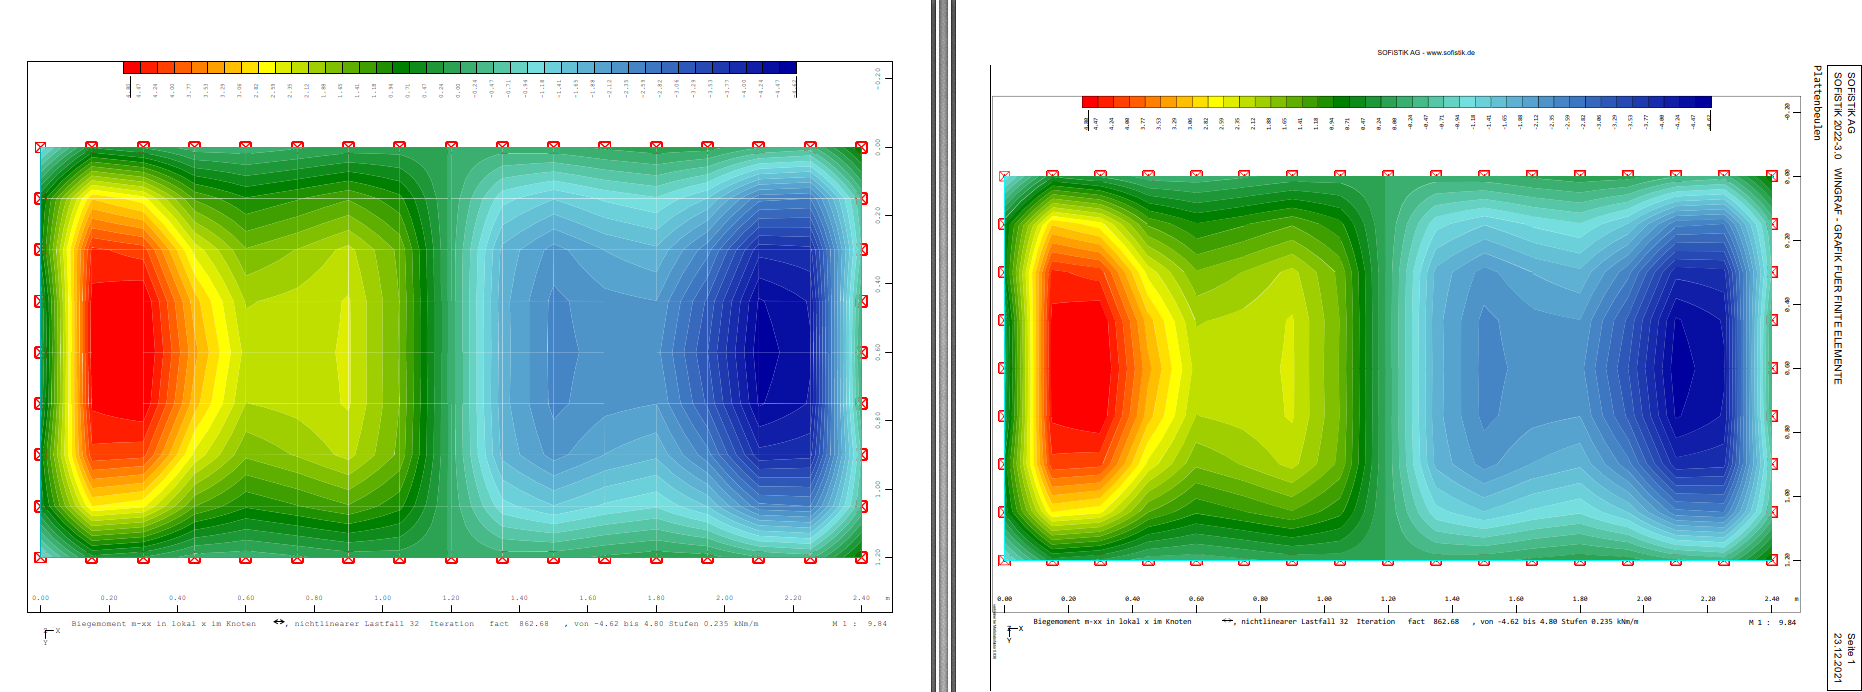
Whenever I print wingraf outputs to PDF the iso areas on the plot seem to split up and look fragmented in the PDF, they look solidly filled in wingraf itself. Im sure its a simple fix but I cant find the option to switch this off anywhere, I am wanting the PDF to be solidly filled. Please see picture below:
I’m not sure why Graphic is printing the finite elements inside the iso areas. I will ask the responsible developer about this behaviour.
At the moment you can export the graphic file as .plb and then print the Report Browser file as a pdf.
Thanks for reply.
I tried that too but the PNGs are not vectorized images so you can’t zoom in without making the picture blurry. The graphics in PDFs are vectorized.
Not sure if there’s a way to export graphics to a vector format, like SVG.