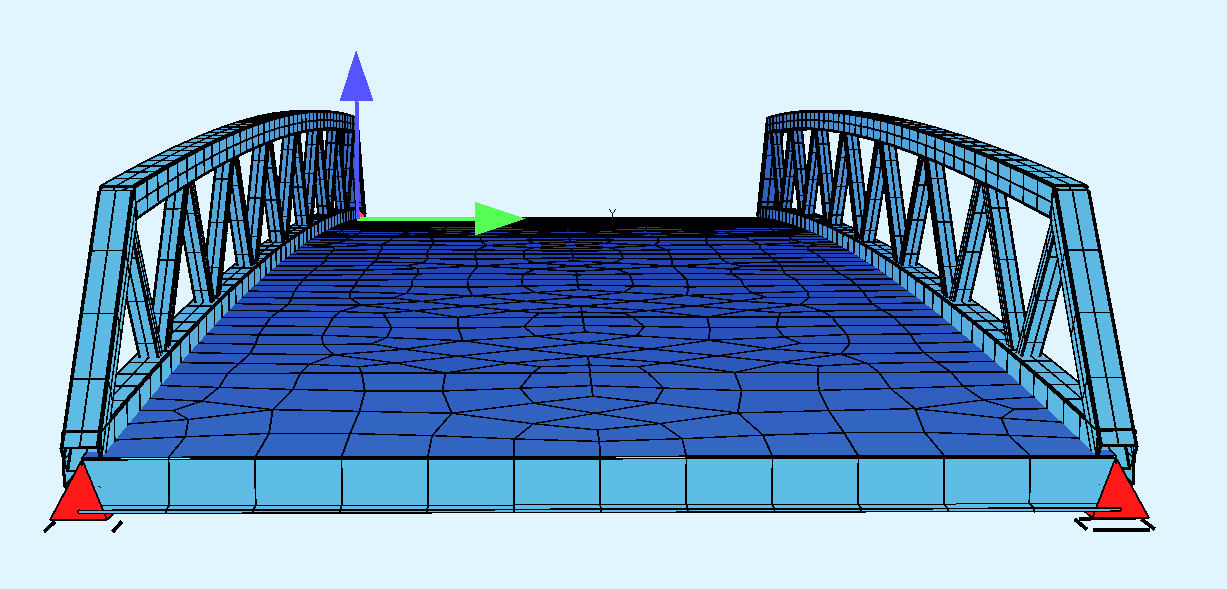
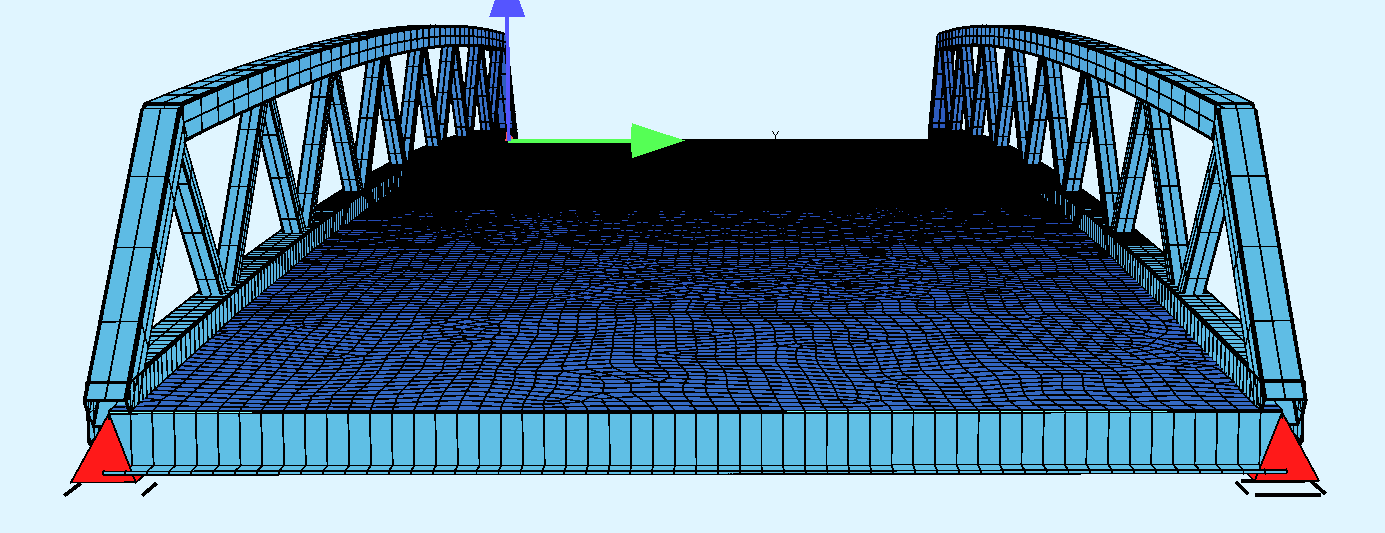
I’m modelling a steel bridge, where i have a deck plate t=10mm supported by T-profile crossbeams.
The cross beams are modelled largely as rigid supported
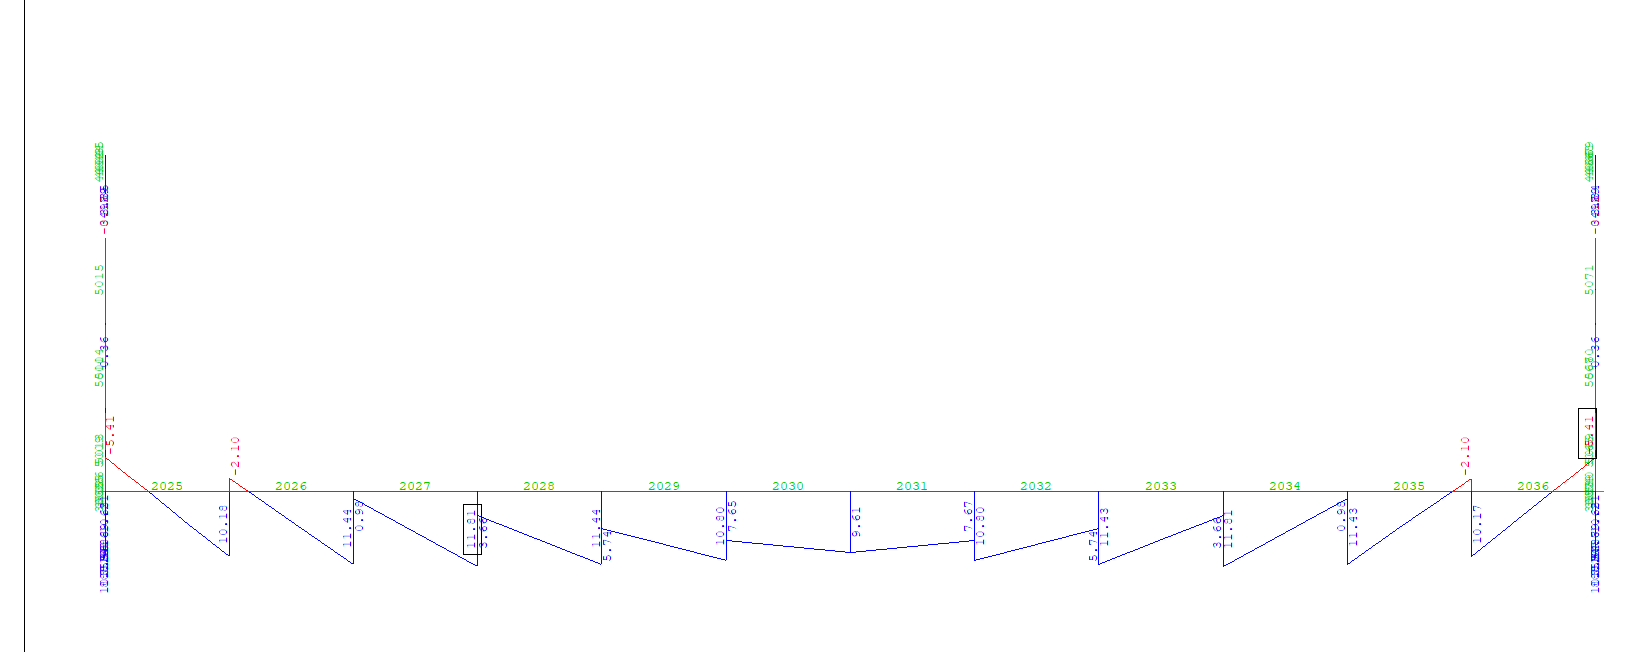
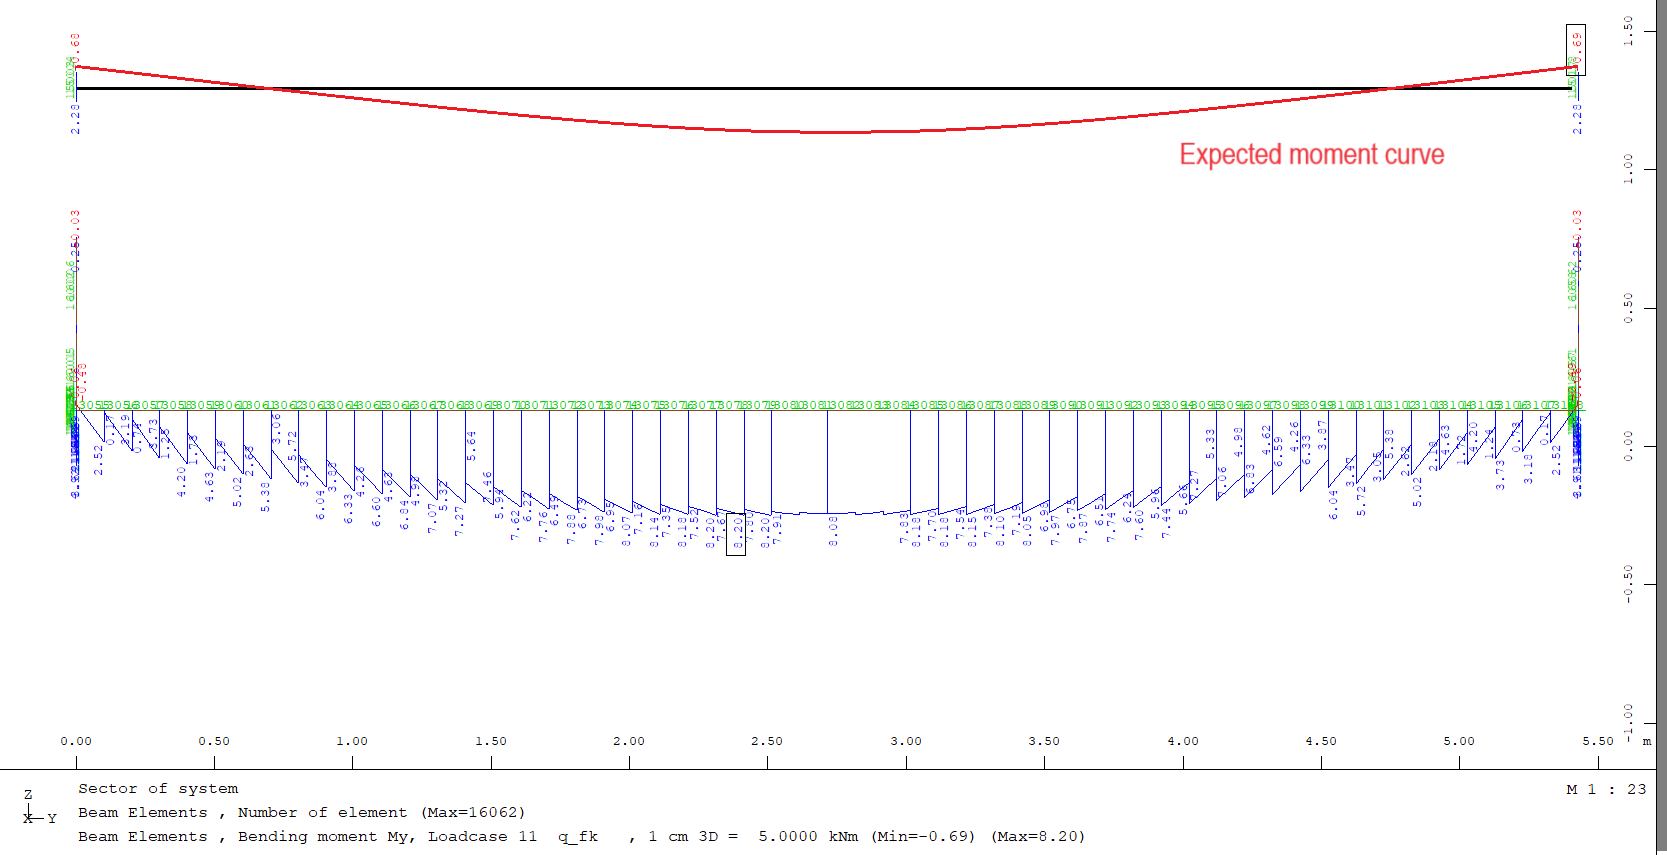
From a imposed area load of 5 kPa, I get the odd (wrong) moment curve shown below with large discontinuities where mesh is placed.
This is normal. Quads normal force is constant and beams is not. Try fine mesh then diagram will be smoother then since the difference of normal force will be lower
Hi I increased the mesh density, and while it converges to a better result, it is still quite unacceptable, as i have no reliable telling of what the moment will be near the edge beams. It’s not feasible to increase the mesh size further.
This is how it is in FEA. It is discrete method.
The saw shaped diapgram is due to difference of normal force along beam element, caused be shear (thats why it occurs mostly near support).
It is similar like you would model beam like truss when force is constant along truss modulus.
It should be safe for design purpose though, since real diapgram is like average of peak values.
Also, your expected moment diagram may be wrong, since there is no moment resistant for transverse girder by truss main girder due to lack of torsional stiffness, so it works as simply supported beam.
Okay so when investigating a certain point where one have two different values (points of discontinuities), I could perhaps average between the two values for a “more” true value?