What graphic tools does the software have to limit the maximum and minimum effort present in a figure and avoid color saturations when there are points of singularity?
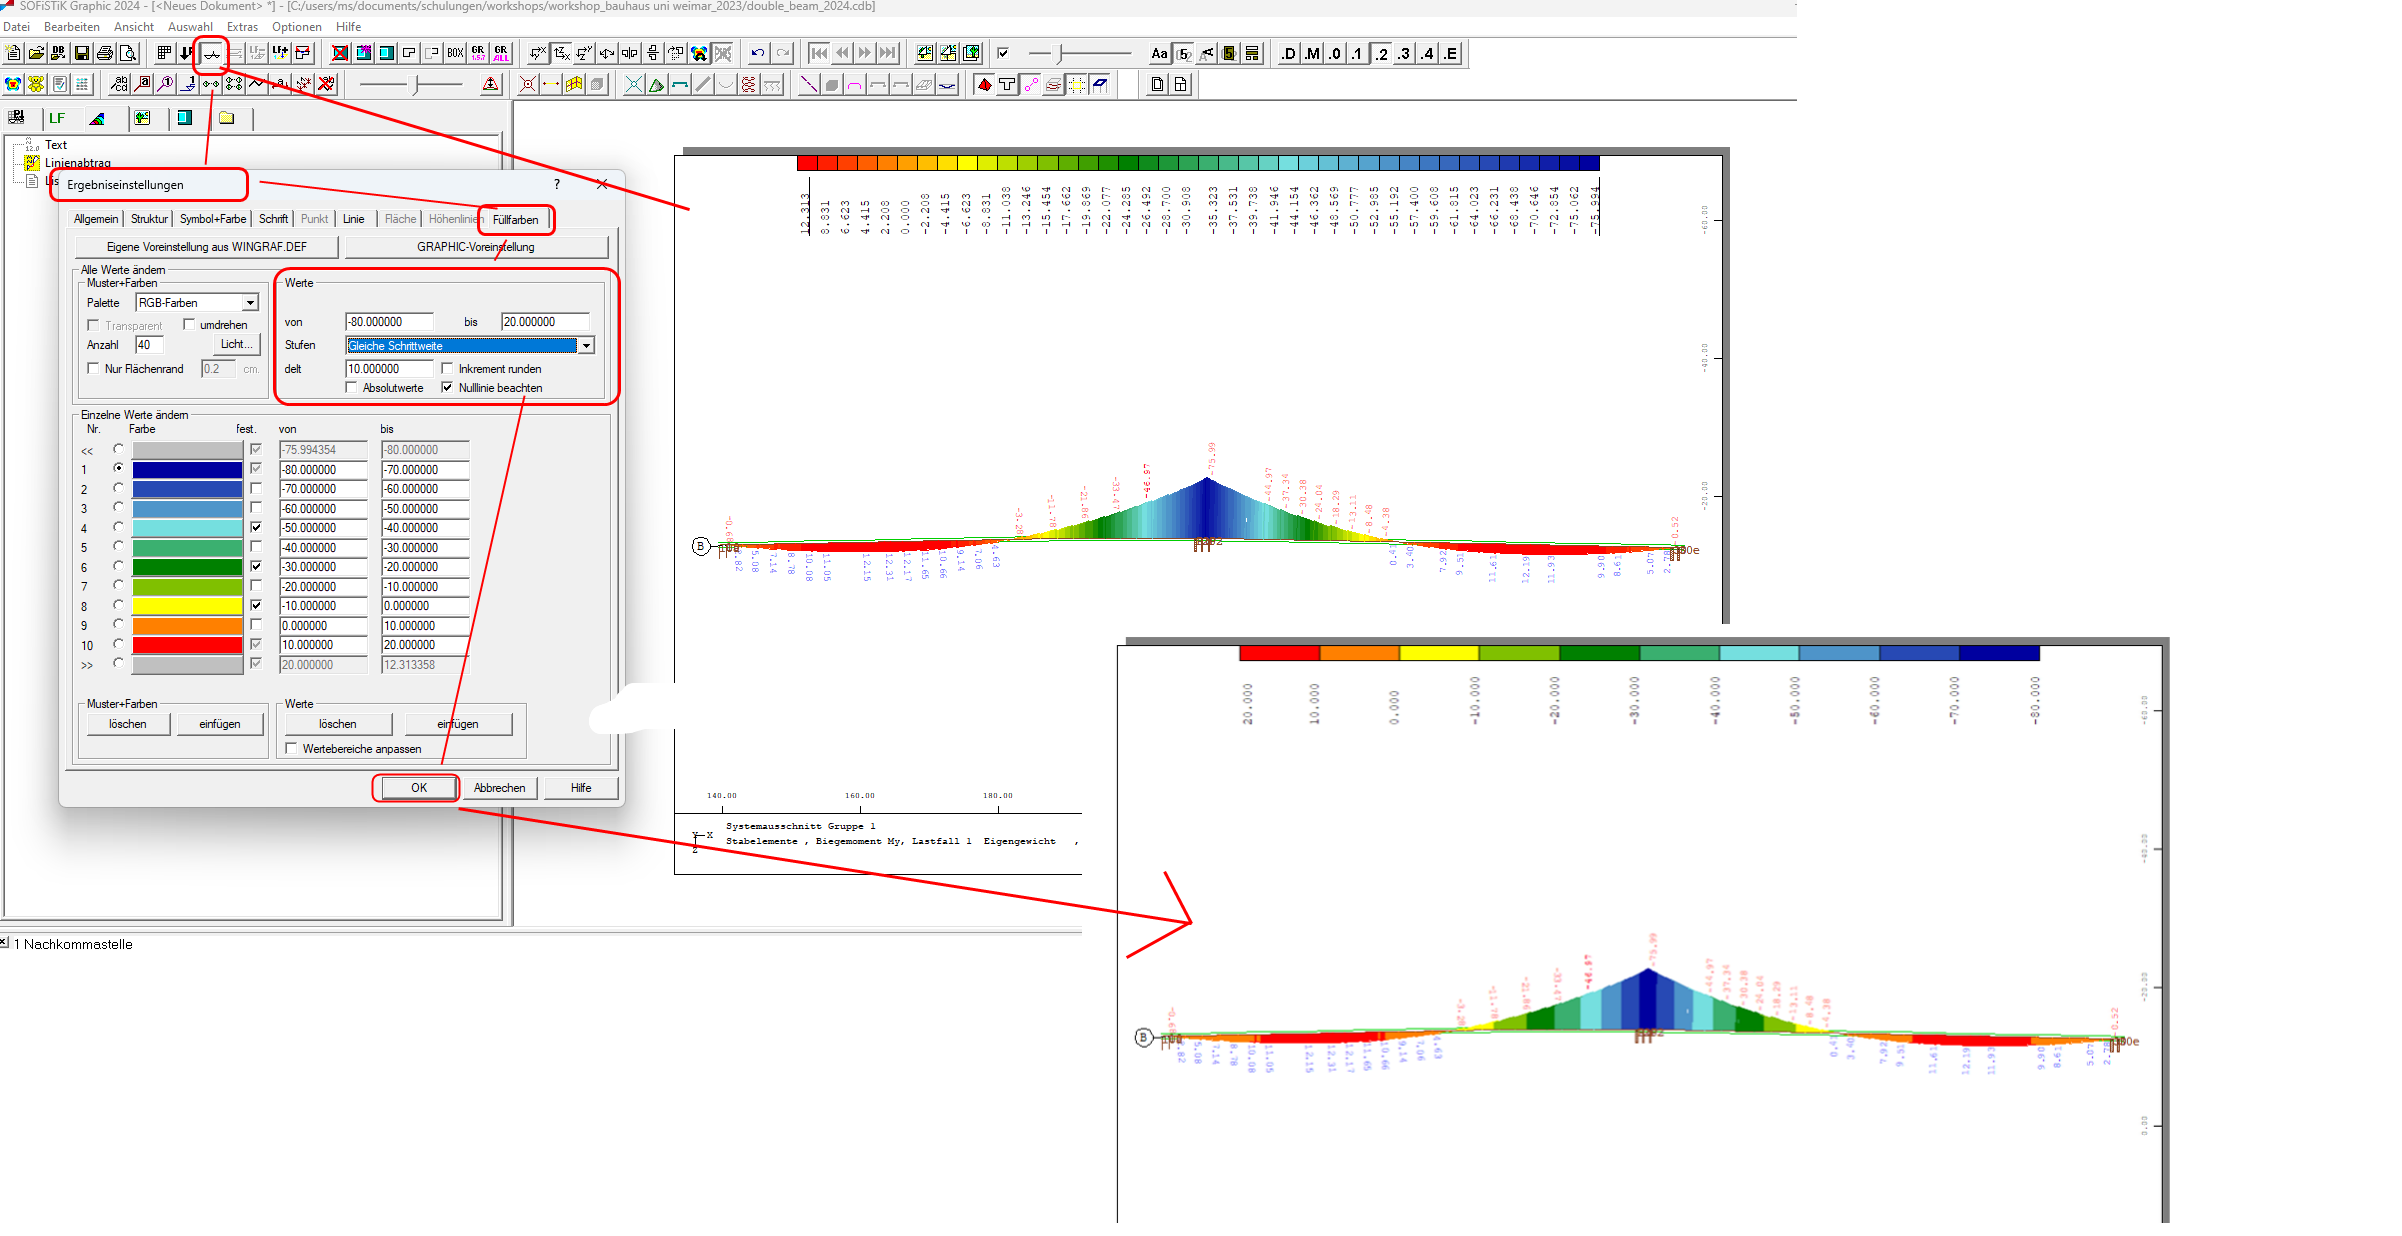
For graphical representation of the result there is the modul GRAPHICS. All data available from the data base can be shown in various graphical representations. Also you can manually controll the results range, the used colors, and so on.
I strongly recommend to whatch our online training video #13 from our webpage.
All other videos for a full bridge design workflow are available here: SOFiSTiK Bridge Design Training
Also the manual WINGRAF_1.pdf, which you can reach from SSD /TEDDY menu help, will give you more information.